Research and Development in Hong Kong: The Way Forward
Figure 1Gross Domestic Product (GDP) per capita for Hong Kong and the US over the past 40 years
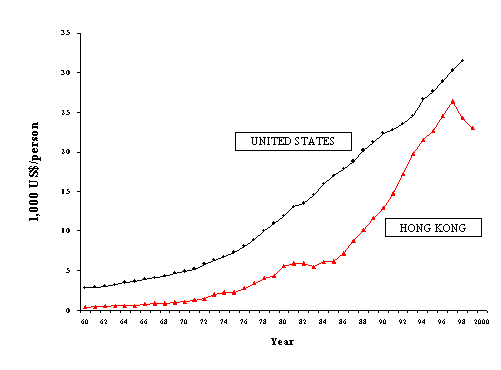
Figure 2Total expenditure on R&D as a percentage of GDP in 1998 (from World Competitiveness Yearbook, 2000)
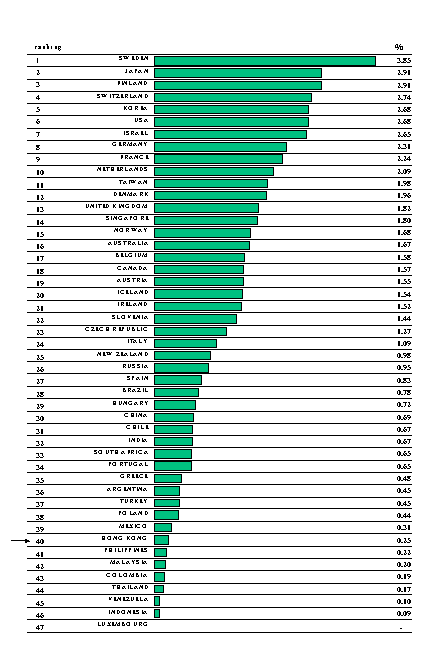
Figure 3GERD in Singapore over recent years (a) Public and private sector expenditures in R&D (b) GERD/GDP ratio
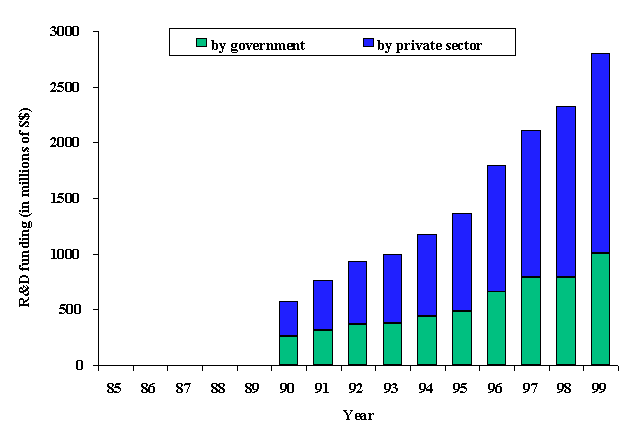
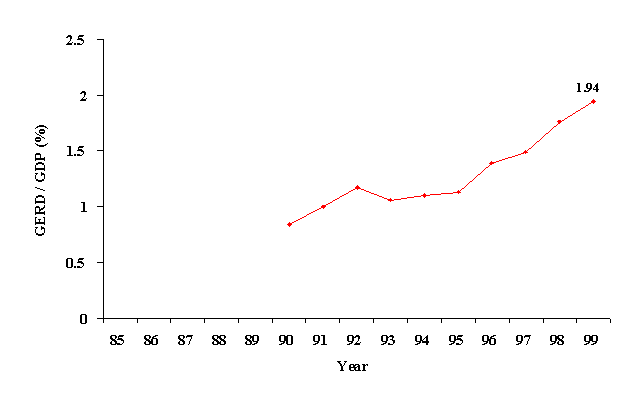
Figure 4GERD in Taiwan over recent years (a) Public and private sector expenditures in R&D (b) GERD/GDP ratio
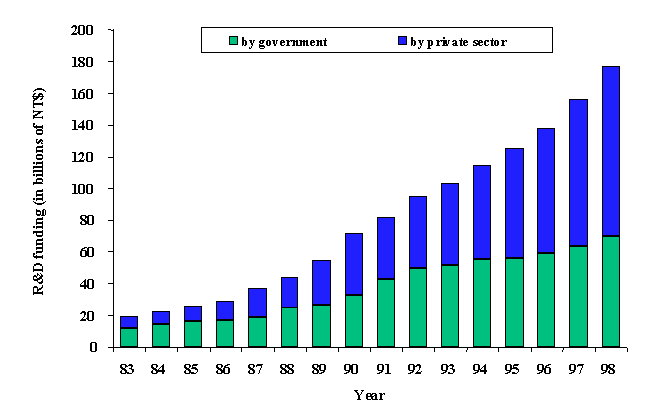
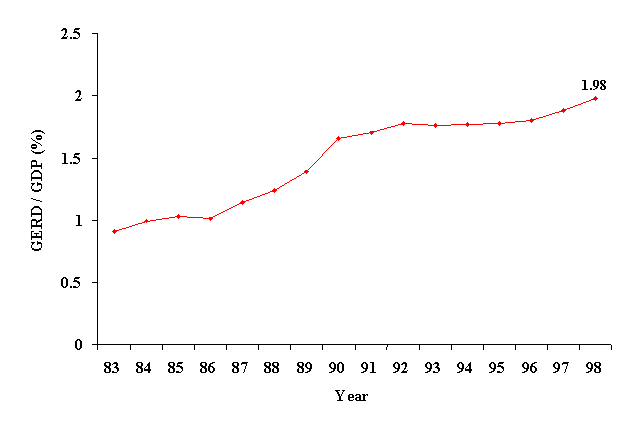
Figure 5Postulated long-term trend in the GERD/GDP ratio of nations as the degree of technological sophistication of an economy evolves. At the beginning of this time series, the private/public R&D investment ratio is 30/70. Towards the end it becomes 70/30.
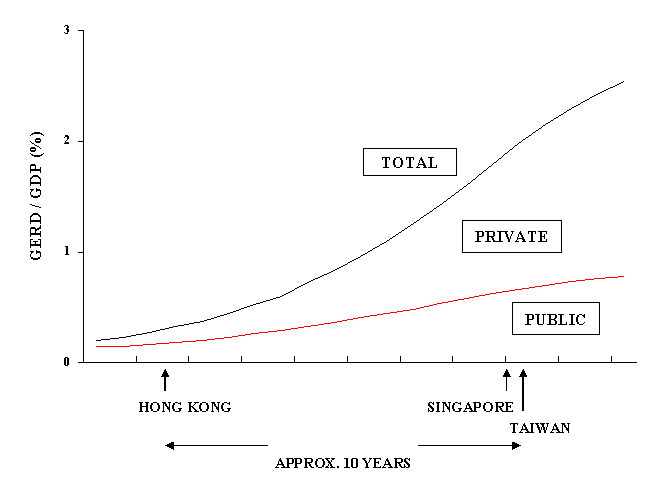
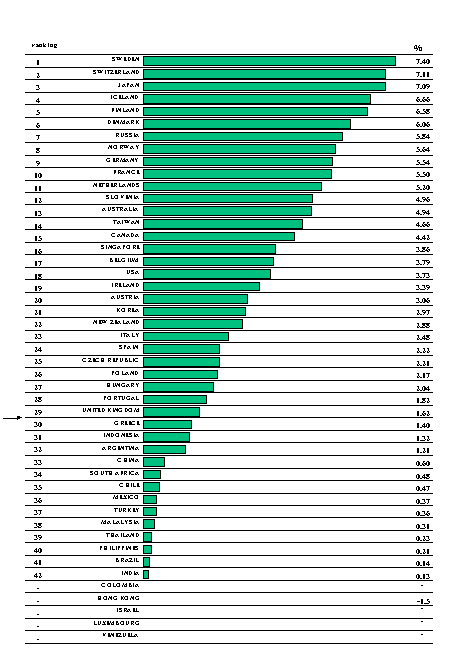
Figure 6Total R&D personnel per 1000 population in 1998 (from World Competitiveness Yearbook, 2000)
